Factors That Shape Breakthrough Curves
Factors Affecting Breakthrough Curves in Adsorption Columns
Introduction
Breakthrough curves serve as vital diagnostics in fixed-bed adsorption column operation, widely employed for water purification, gas separation, and chemical processing. These curves reflect the dynamic concentration of an adsorbate in the effluent over time, correlating adsorption kinetics, thermodynamics, and mass transfer to practical column performance.
What Are Breakthrough Curves?
Breakthrough curves are fundamental performance indicators in fixed-bed adsorption systems. They represent how an adsorbate’s concentration in the column effluent changes over time, providing insight into adsorbent capacity, mass transfer behavior, and overall column efficiency.
In practical terms, breakthrough curves help engineers determine when an adsorbent bed becomes saturated and needs regeneration or replacement. These curves are extensively used in water purification, gas separation, air filtration, and environmental remediation processes.
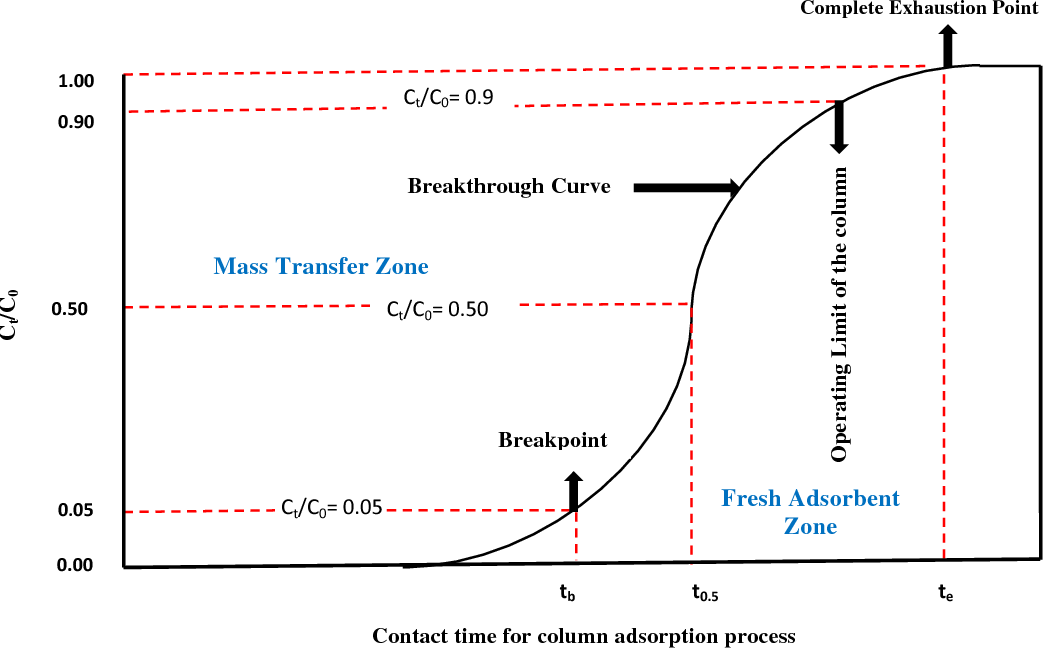
Illustrates effluent concentration vs. time, showing breakthrough and exhaustion points.
Key Factors Affecting Breakthrough Curves
Below are the most influential parameters that shape breakthrough behavior in adsorption columns:
1. Adsorbent Capacity
A higher adsorption capacity results in a delayed breakthrough and improved removal efficiency. Selection of an adsorbent with high equilibrium capacity and selectivity is crucial for optimizing system performance.
Example: Activated carbon vs. zeolites show distinct curve shapes due to differing sorption capacities.
2. Adsorption Kinetics
Fast adsorption kinetics yield sharper, more defined breakthrough curves. Factors improving kinetics include:
- Higher mass transfer rates
- Reduced film diffusion resistance
- Minimized intra-particle diffusion limitations
When mass transfer is slow, the breakthrough curve becomes broader, indicating inefficient utilization of the adsorbent bed.
3. Flow Rate
Flow rate significantly impacts contact time between the fluid and the adsorbent:
- High flow rates: Faster breakthrough, lower efficiency
- Low flow rates: Extended contact time, higher uptake but slower throughput
Optimizing flow rate ensures a balance between adsorption efficiency and process economics.
4. Bed Height and Column Depth
Increasing bed height delays breakthrough, increases the mass transfer zone length, and enhances total removal efficiency. However, excessively deep beds may cause pressure drop issues and higher energy costs.
5. Particle Size and Porosity
Smaller particles provide higher surface area and faster diffusion, leading to sharper curves. Larger particles reduce pressure drop but have slower kinetics. Porosity plays a key role in facilitating intraparticle diffusion.
6. Axial Dispersion and Hydrodynamics
Axial dispersion causes solute spreading, resulting in broadened mass transfer zones and flattened breakthrough curves. Proper column packing, distributor design, and laminar flow minimize dispersion.
7. Temperature and Inlet Concentration
A higher temperature usually decreases adsorption (for physical adsorption). A higher inlet concentration leads to faster bed saturation and a steeper curve front. Controlling these parameters ensures stable operation.
8. Adsorption Isotherms
The isotherm type (e.g., Langmuir, Freundlich) defines the equilibrium and helps predict breakthrough curve shapes, determine capacity limits, and support scale-up models.
9. Thermal Effects
Adsorption is often exothermic, causing localized heating. Excessive heat can lower adsorption capacity. Temperature management (e.g., cooling jackets) is vital in industrial-scale columns.
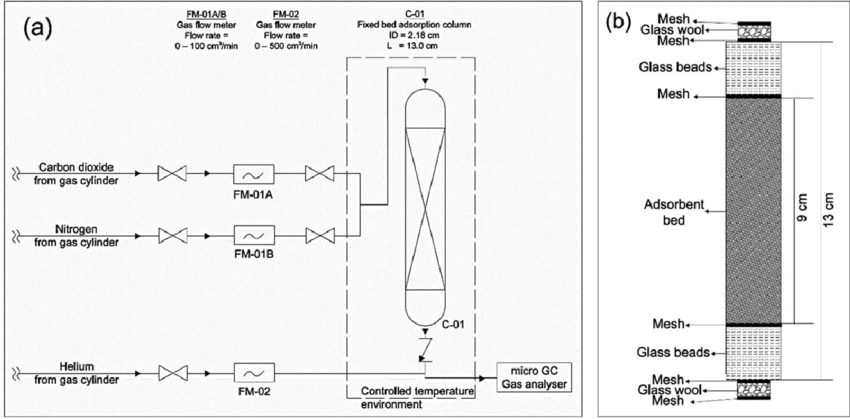
Depicts flow direction, adsorbent bed, inlet/outlet streams, and sampling ports.
Breakthrough Curve Modeling and Scale-Up
Modeling is essential for predicting full-scale performance. Commonly used models include:
- Adams–Bohart Model: For early-stage adsorption kinetics.
- Thomas Model: For overall system capacity estimation.
- Yoon–Nelson Model: Simple and practical for performance prediction.
Accurate parameter estimation and model validation ensure reliable scale-up from lab to industrial systems.
Visualizing and Optimizing Breakthrough Curves
A well-presented breakthrough curve shows:
- An S-shaped profile with distinct breakthrough and exhaustion points.
- Mass transfer zone (MTZ) annotation for clarity.
- Effects of flow rate, temperature, and kinetic limitations clearly marked.
Engineering Insight: Optimization involves balancing adsorbent utilization, energy efficiency, and regeneration frequency—key to cost-effective adsorption design.
Conclusion
Understanding the factors influencing breakthrough curves enables process engineers to design efficient, scalable, and sustainable adsorption systems. By integrating insights from adsorption isotherms, kinetics, and hydrodynamics, industries can achieve higher separation efficiency and optimized column operation.